
DigitalFootprint.earth

Yannis Panagis / April 4, 2021 (2y ago)
DigitalFootprint.earth is a project I started working on together with @samlarsendisney for the Esri X TechCrunch Hack for a Sustainable Future.
Esri and TechCrunch called on developers around the world to imagine new approaches to the most pressing global challenges, from the climate crisis to COVID-19. All participants were given free access to Esri's ArcGIS platform to biuld their projects and the winners were announced at TechCrunch Disrupt's 2021 conference.
As web developers, we care deeply about the web and the impact it has on society. We wanted to make this hack about a sustainable future personal.
By trying to improve the performance of our personal sites by peaking through lighthouse audits, we realised far more data was transferred when a page loads than we thought. Every byte of energy sent requires energy, which in turn produces CO2 and other greenhouse gases. With billions of people and pages on the web it became clear, that the tool we love the most ~the internet~ was doing a lot of harm to our planet.
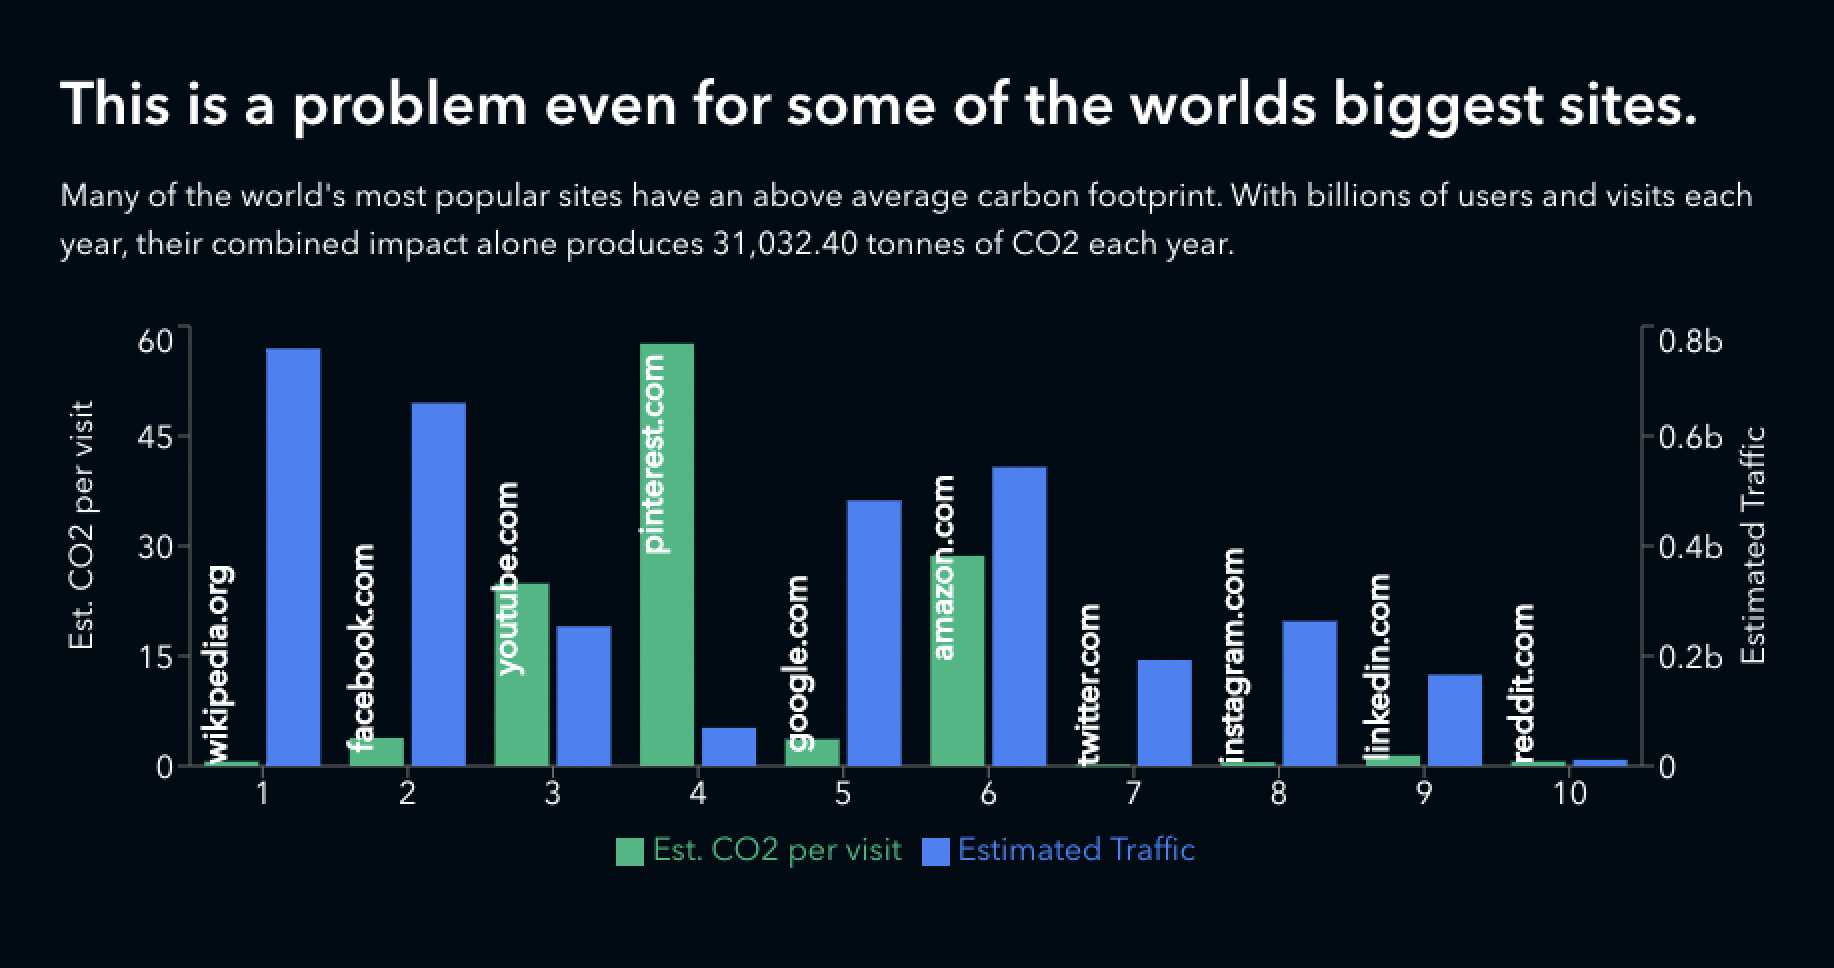
According to the BBC, the internet is responsible for nearly 3.7% of all global CO2 emissions. Another study by the Boston Consulting Group (BCG) estimates that the internet produces almost 1 billion tonnes of greenhouse gases each year. The scale of this problem is scary because when you think twice about these numbers, its clear that the environmental impact of the internet parallels that of plastic. The cloud where we store our data has a physical presence in thousands of data centres around the world.
To make things worse, the internet isn't put under nearly the same amount of scrutiny or the same standards as continue to try to achieve the United Nation's 2025 Sustainability Goals. We can do a lot better.
What does it do?
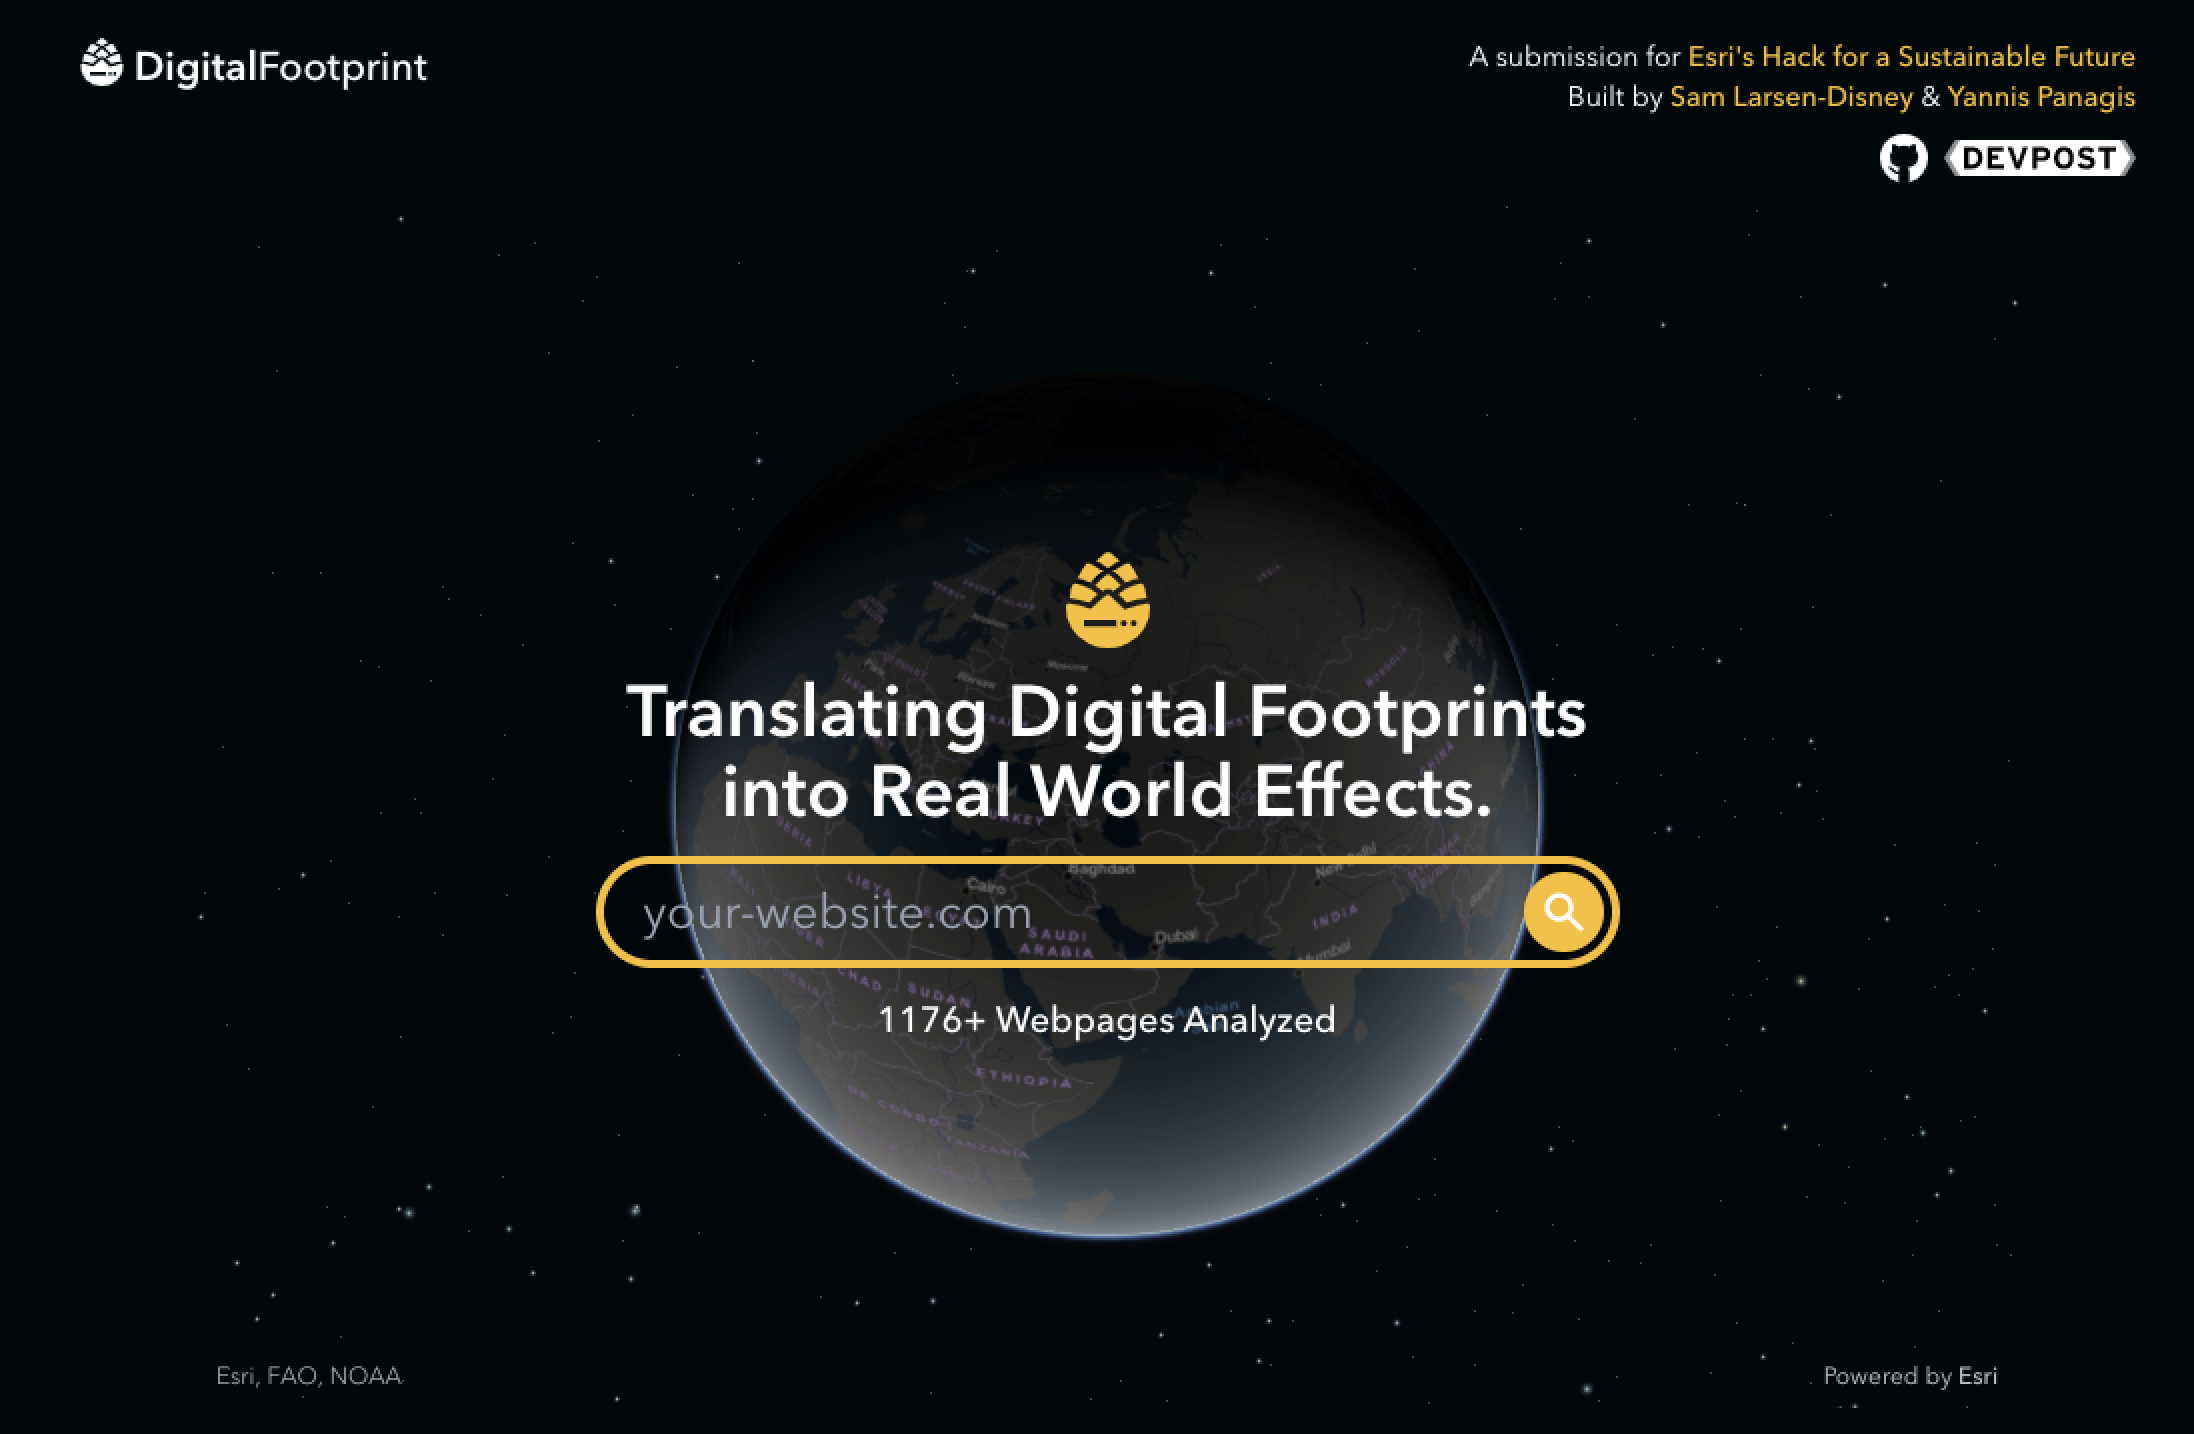
Our project submission, DigitalFootprint.earth, uses mathematics and ESRI's mapping APIs to estimate and visualize the carbon footprint of the web. We split our project into three parts:
- Story Telling: By using ESRI's ArcGIS API, DigitalFootprint.earth takes seamingly meaningless data and translates it into a tangible story that shows how serious the impact of the internet can be on our planet.
- Investigation: DigitalFootprint.earth investigates a site's hosting, CDN, performance and size to suggest improvement mechanisms and simple steps to make the internet a greener place.
- Auditing: By using DigitalFootprint.earth's web application and API, developers can consistently monitor and improve their site's performance, CDN response time, and other metadata via our scoring system. We also created a custom server-side-generated badge that can be displayed on a website to demonstrate to users that the developers are holding themselves accountable to ensuring their site is as green as can be.
This project was built over three weeks and there are a number of assumptions in the calculations though they provide a good starting point for any investigations!
Challenges
We ran into a number of challenges during this hackathon but I think that's part of what makes the experience so memorable - transforming an idea from something we thought to be impossible into a product people could actually use and maybe even benefit from! Some of these main challenges were:
- Working with a brand new API: Esri's ArcGIS API was new to both of us and it was incredibly extensive. With such a large feature set things felt overwhelming at first and some parts of the API such as the service area API proved to be particularly tricky to get our heads around.
- Using ArcGIS with Gatsby: We wanted to use a framework like Gatsby or Next for this project (we used Gatsby for this one!) and the SSR that it utilises didn't work nicely out of the box with the ArcGIS maps. This meant we had to make some interesting modifications to lazy load in the map and use framer motion to make the transition more graceful.
- Generating badges on the server: It's not the most immediately obviously complicated task but generating images on a server - with out the DOM - was not easy because of how the HTML had to dynamically update based on the request parameters.
- Data sourcing: Collecting data to substantiate a lot of the calculations, insights and findings and to integrate these with our tools was one of the biggest challenges.
TechCrunch
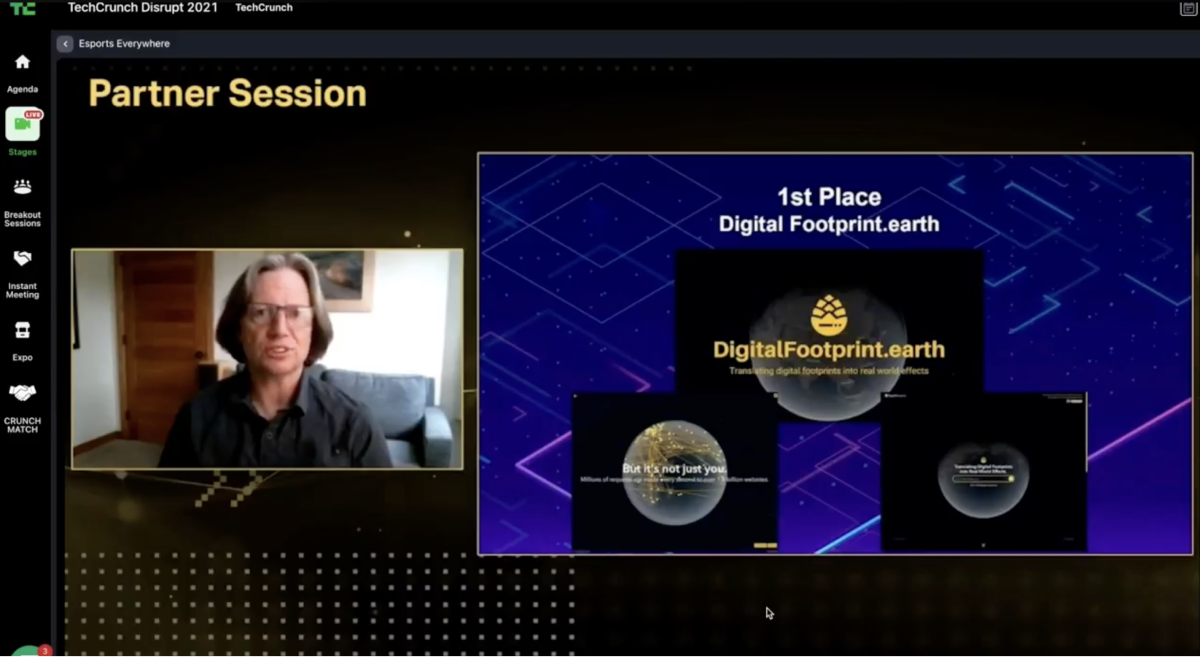
We got the opportunity to present this project at TechCrunch Disrupt 2021 on the main stage in the finale of the competition! The image below is a screenshot from the moment when we found out that, to my disbelief, our project won the competition and took home the $10,000 prize and got the opportunity to present at Esri's Developer summit in 2022 too!
BONUS: What else can I do today to reduce my digital footprint on the web?
If you don't host your own site, that doesn't mean that there's nothing you can do to help reduce your carbon footprint through your internet usage. Here's a short list of some other small steps you can take that can go a long way toward helping our planet:
- Keep your hardware longer: the devices you access the internet through, whether its your laptop, phone or tablet have a heavy environmental footprint both through their manufacturing processes, day-to-day use and disposal.
- Delete your old emails: storing large amounts of data can also increase your digital footprints. Deleting those emails you haven't looked at or used for years can go a long way toward reducing the impact you have on the environment
- Unsubscribe: Email subscriptions and mailing lists produce a lot of CO2. Unsubscribing from the email lists that you don't read instead of letting them pile up in your inbox is another quick step you can take to be a greener citizen of the internet
Try it out today!
At the time of publishing this post, DigitalFootprint.earth is still live. Why not try it out today by clicking here
You can also read more about the project in detail on the DevPost submission!