Machine Learning for COVID Detection

Yannis Panagis / April 27, 2020 (3y ago)

Between my third and fourth year of university we had to complete a placement project for a company in industry. In my case, we were fortunate enough to be offered the opportunity to apply to self propose a project in conjunction with the Imperial College NHS Trust Hospitals and the Centre of BioInspired Technology at Imperial College London.
In this project, we used machine learning to develop models to create patient risk scores for COVID-19 and for probabilistic inference for a clinical decision support system in the NHS called EPiC IMPOC run by the Centre of BioInspired Technology at Imperial College London.
Where did the need for this project come from?
The first case of COVID-19 was detected in Wuhan, China on the 31st of December, 2019. Within three months, the World Health Organization (WHO) characterized the viral disease as a pandemic because of its high reproduction rate and threat to global public health. With the UK's ever-increasing death toll and number infected, the government imposed a lockdown, shutting down all non-essential services on the 23rd of March 2020. Although restrictions across the globe are lifting, the UK and many other countries continue efforts to limit the spread of the virus and protect the National Health Service (NHS) from being overwhelmed.
According to the NHS, as of Saturday, the 23rd of May 2020, there have been 257,154 total lab-confirmed cases, 36,675 total associated deaths. Each day, the NHS estimates that there are another 2,959 daily lab-confirmed cases and another 282 daily associated deaths across the UK. The NHS reports the number of daily cases and associated deaths continues to decline. However, the implications of easing lock-down restrictions is important to consider in preventing the spread or resurgence of the virus.
There quickly came a crucial need for technical solutions such as clinical decision support systems to improve patient diagnosis, risk assessment and the distribution of medical resources for infection management.
What is a Clinical Decision Support System?
A clinical decision support system (CDSS) is intended to improve healthcare delivery by enhancing medical decisions with targeted clinical knowledge, patient information, and other health information. CDSSs are composed of two main categories, knowledge based and non-knowledge based. In short, the knowledge based CDSS a predefined set of rules is created based on evidence from literature, practice, or patients. Alternatively, the non-knowledge based CDSS relies on artificial intelligence (AI), machine learning, or statistical pattern recognition.
What did we build?
EPIC IMPOC (Enhanced, Personalised and Integrated Care for Infection Management at the Point of Care) is a clinical decision support system used in the NHS to improve the management of infectious diseases by facilitating data collection, infection diagnostics and antimicrobial therapy advice at the point of care.
In this project, we built a new module for EPIC IMPOC that focused specifically on integrating then current medical knowledge of COVID-19 and patient data with an inference engine to predict the likelihood of infection, the severity of infection, and to allow clinicians to retrieve the most similar patients to an individual patient at the point of care. Additionally, the patient retrieval system is packaged in a mobile and desktop friendly panel for clinicians within EPIC IMPOC to identify patients with similar severity levels, symptoms, and medical histories in the UK.
This EPIC IMPOC module was one of the first to undergo clinical trials in the NHS, starting in early July 2020. This solution will be a crucial part of the Imperial College Healthcare NHS Trust’s COVID-19 response to the second wave in the pandemic. The Trust’s five hospitals currently treat more than 1.125 million patients and employ 11,800 people annually.
Implementing a clinical decision support system for COVID-19 comes with a unique set of technical, social, and medical challenges. Mainly, the technical approach must adapt to the rapidly changing data and medical knowledge available. Furthermore, limited data creates challenges in developing robust machine learning algorithms to provide advanced, intelligent decision support for clinicians at the point of care. This required extensive research and testing of different algorithmic approaches, tuning their hyper-parameters and evaluating their limitations and strengths. The following sections of this report will include a literature review, the design criteria, a system architecture description, as well as a breakdown of the core components used in this module to overcome these challenges.
System Architecture
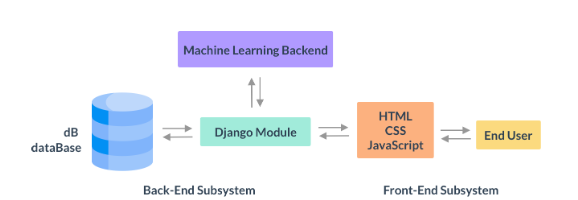
The module performs two functions: the retrieval of similar cases and the risk assessment of patients in terms of COVID-19 infection.
A variety of technologies were used in the development of this CDSS module including but not limited to Python, Sci-kit learn, Pandas, MatplotLib, NumPy, LightGBM, XGBoost, HTML, CSS, JavaScript, Django.
The back-end was developed with a Python framework called Django, which is commonly used as a back-end for web-app development. The Django module interacts with the user via a front-end, developed with HTML, CSS and JavaScript.
The requests from the user via the front-end are then used to either query a database or are evaluated using a Machine Learning-based back-end within the framework. The back-end maintains different views for interactions with different algorithms and features of the module. These views include, for example, a view for the application of probabilistic inference as well as a view that allows clinicians to retrieve similar patients based on the patients they select from the view.
When the machine learning module is called, the pipelines developed in the research phase of this project are applied to the data, which is then returned via the Django framework to be rendered on the front-end.
The end-user, which is likely to be a clinician or medical care worker, interacts only with the front-end of the system. The front-end encapsulates all of the complexity of the system to present the information and functionality to the end-user in the simplest possible way via a desktop and mobile responsive panel.
The User Interface (UI) was developed using CSS, HTML and JavaScript. The front-end has the ability to allow clinicians to customise and choose the way they want to control, view and input data. This includes the ability to fill out forms manually, upload large spreadsheets of cases, query databases for existing patients, and perform risk assessments for patients in terms of COVID-19 infection. The abstraction provided by the front-end removes the complexity of data pre-processing, machine learning and database interactions, to streamline the experience for medical care workers.
Risk Assessment Using Probabilistic Inference
The probabilistic inference (PI) function estimates the probability of COVID-19 infection in a patient based on key pathology biomarkers. It was trained and tested on a total of 1186 pathology (Table below). New data can be input by form, existing patient records, or by uploading a CSV file with several patients’ data. Three machine learning algorithms among other tested algorithms, each giving a different result, are used: LightGBM, Random Forest Classifier and Decision Tree Classifier. If a form or existing patient record is used, three different estimates are returned. In the case of a CSV file, an updated file with three new columns is returned, each column corresponding to a different estimator.
The following table summarises the class distribution for the important datasets used in the Probabilistic Inference Module
| Data | Total | Covid-19 positive | Covid-19 negative | | ------------------ | ----- | ----------------- | ----------------- | | Pathology | 77351 | - | - | | Labels | 1675 | 976 | 699 | | Pathology ∩ Labels | 1186 | 758 | 428 |
Patient Retrieval - Case Based Reasoning
The CBR system retrieves similar patients and provide them to the clinicians to support them with treatment prescription. The patients’ retrieval is going to be done using the pathology dataset which contains 837 pathology profiles of and the vital signs dataset which contains the vital signs, symptoms, radiology results and medical history of 262 patients (in the table below). For the former, a supervised and an unsupervised method were used, while for the latter only the supervised methodology was followed.
In the supervised approach, the weighted distance between a given patient and the remainder of cases is computed and the most similar cases are selected. These weights are pre-computed using each feature’s importance from the Random Forest. The system's performance was evaluated using the patient’s outcome to verify and investigate patient similarities. Different distance metrics, filters, imputers and scalers were tested and selected to maximise the performance.
On another hand, the unsupervised approach for CBR, uses an HDBSCAN algorithm initialised with the same pre-computed weights to cluster similar patients by their biomarkers and symptoms. The primary advantage of using a clustering algorithm is that it does not require re-sampling, imputation, and most importantly, labels.
The following table shows the class distribution for the important datasets used in the CBR Module.
| Data | Total | Admitted to the ICU | Not Admitted to the ICU | Died | Survived | | ----------- | ----- | ------------------- | ----------------------- | ---- | -------- | | Pathology | 837 | 443 | 394 | 517 | 214 | | Vital signs | 262 | 31 | 221 | 60 | 202 |
Aside from the extensive functionality provided by the module, another key component of this system is the development of an intuitive app that clinicians can easily interact with at the point of care. The figure depicts a high level view of the system architecture. The following sections investigate the development of each component of the system and explain their inner workings in more detail.